A mock data set containing 10 sets of predictions and corresponding labels as would be obtained from 10-fold cross-validation.
data(ROCR.xval)Format
A two element list. The first element, ROCR.xval$predictions, is
itself a 10 element list. Each of these 10 elements is a vector of numerical
predictions for each cross-validation run. Likewise, the second list entry,
ROCR.xval$labels is a 10 element list in which each element is a
vector of true class labels corresponding to the predictions.
Examples
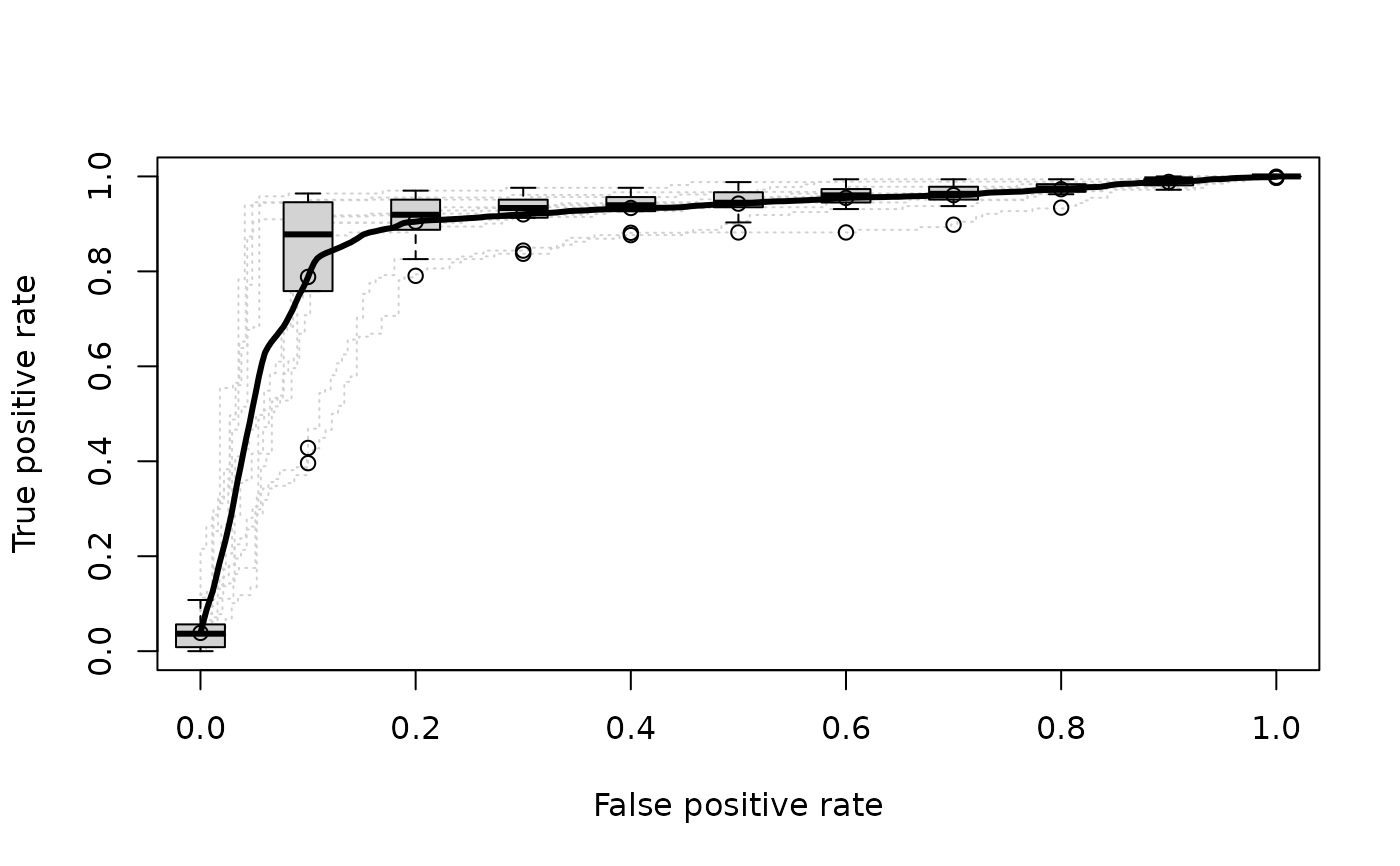
# plot ROC curves for several cross-validation runs (dotted
# in grey), overlaid by the vertical average curve and boxplots
# showing the vertical spread around the average.
library(ROCR)
data(ROCR.xval)
pred <- prediction(ROCR.xval$predictions, ROCR.xval$labels)
pred
#> A prediction instance
#>   with 10 cross validation runs (equal lengths)
perf <- performance(pred,"tpr","fpr")
perf
#> A performance instance
#>   'False positive rate' vs. 'True positive rate' (alpha: 'Cutoff')
#>   for 10 cross validation runs
plot(perf,col="grey82",lty=3)
plot(perf,lwd=3,avg="vertical",spread.estimate="boxplot",add=TRUE)