A mock data set containing a simple set of predictions and corresponding class labels.
data(ROCR.simple)Format
A two element list. The first element, ROCR.simple$predictions, is a
vector of numerical predictions. The second element,
ROCR.simple$labels, is a vector of corresponding class labels.
Examples
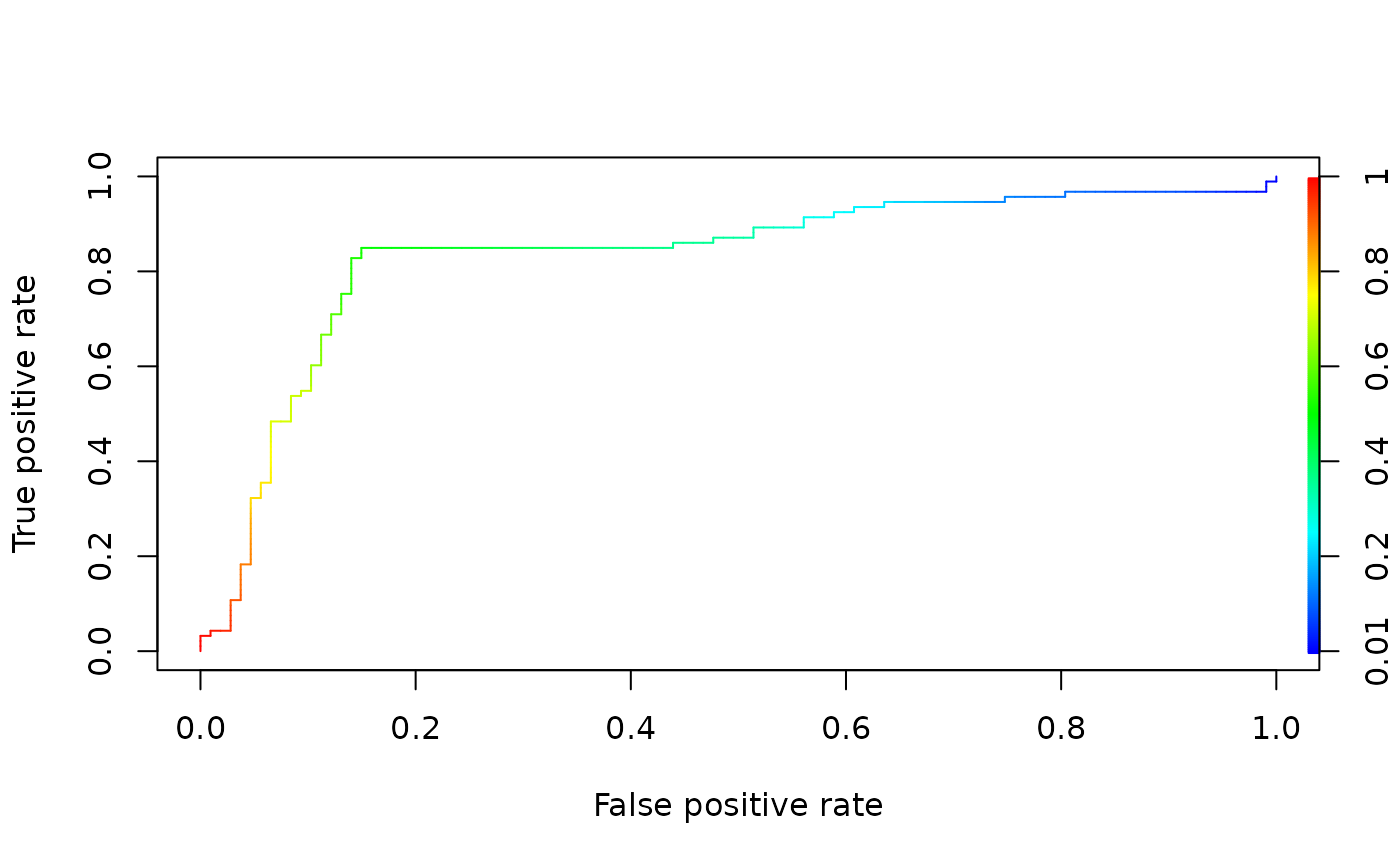
# plot a ROC curve for a single prediction run
# and color the curve according to cutoff.
library(ROCR)
data(ROCR.simple)
pred <- prediction(ROCR.simple$predictions, ROCR.simple$labels)
pred
#> A prediction instance
#>   with 200 data points
perf <- performance(pred,"tpr","fpr")
perf
#> A performance instance
#>   'False positive rate' vs. 'True positive rate' (alpha: 'Cutoff')
#>   with 201 data points
plot(perf,colorize=TRUE)